Analyses on Export of China's Flanges to the EU and the US (Part Two)
2. The total weight of exported China's steel flanges
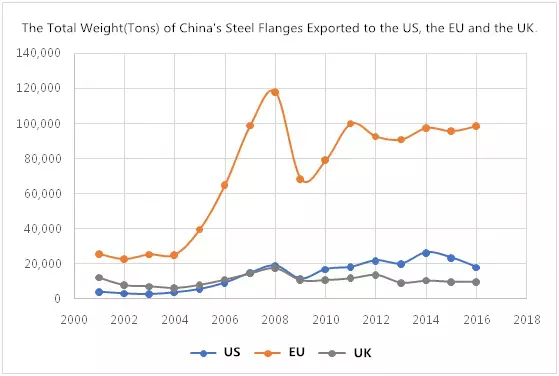
The total weight of China's steel flanges exported to the United States, the United Kingdom, the European Union and the major countries in the EU since 2012 is shown in Figure 2 and Figure 3. The data all come from the International Trade Center Database under the United Nations Development Program, and they are about China's exports instead of China's imports. Here, China refers to the Chinese mainland, excluding Hong Kong, Macao and Taiwan.
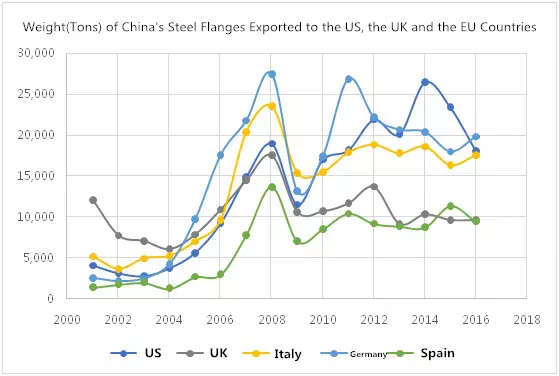
The total weight of China's steel flanges exported to the United States, the United Kingdom, the European Union and the major countries in the EU since 2012 is shown in Figure 2 and Figure 3. The data all come from the International Trade Center Database under the United Nations Development Program, and they are about China's exports instead of China's imports. Here, China refers to the Chinese mainland, excluding Hong Kong, Macao and Taiwan.

It can be seen from Figure 2 that the average annual export volume of China's steel flanges exported to the United States and the United Kingdom is between 10,000 and 20,000 tons, and that China's steel flanges exported to the United States has exceeded those exported to the United Kingdom since 2008. Since 2011, the average export volume of China's steel flanges exported to the EU has been maintained at the level between 90,000 to 100,000 tons, and in 2016, the the average export volume underwent a slight growth of 3.0%.
Since 2001, China's steel flanges exported to the United States, the European Union and the United Kingdom have maintained a year-on-year growth trend, and the growth reached its peak in 2008. Then the export volume of China's steel flanges began to sharply decline in 2009, and the export volume of steel flanges exported to the United States, the European Union and the United Kingdom fell 39.2%, 42.0% and 39.6% respectively. Since 2009, China's steel flanges exported to the European Union has kept growing greatly again. The export volume rose to 10,000,000 tons in 2011, and has maintained about 100,000 tons since then. Since 2009, there have been more and more steel flanges exported to the United States, while there have been no major changes on the export volume of China's steel flanges exported to the the United Kingdom.

It can be seen from Figure 3 that China's steel flanges exported to each country all meet the trend that the export volumes kept increasing before 2008, and dropped sharply in 2009. The differences among the export volume of each country after 2009 is that the export volume of each country underwent changes in different degrees. What must be paid attention to is that the export volume of China's steel flanges exported to Germany has greatly increased since 2009, and the average growth rate has reached 43.0% in 2011. Germany had been the largest importer in Europe of China's steel flanges utill 2016.
Related News
- Installation of Main Bolts for Lap Joint Flange in High-Temperature Gas-Cooled Reactors
- Structural Design and Finite Element Analysis of Anchor Flanges
- Key Welding Technology for High-Neck Flange and Steel Pipe Joints
- The Design and Calculation of Stamped Lap Joint Flanges
- Development of Manufacturing Large Anchor Flanges
- Hardfacing the Inner Surface of Long-Neck Flanges Using CO₂ Gas-Shielded Welding
- UHV High-Neck Flange Welding
- Application of High-Neck Flange to UHV Steel Pipe Tower
- Analysis of the Cracking Cause of High-Neck Flanges
- Anchor Flanges for the East-West Gas Transmission Project

